You now have two new pages entirely dedicated to the statistics of your users and reservations. Go to the "Administration" menu:
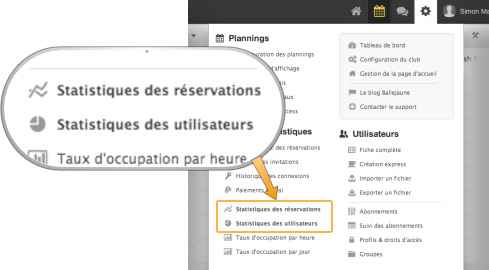
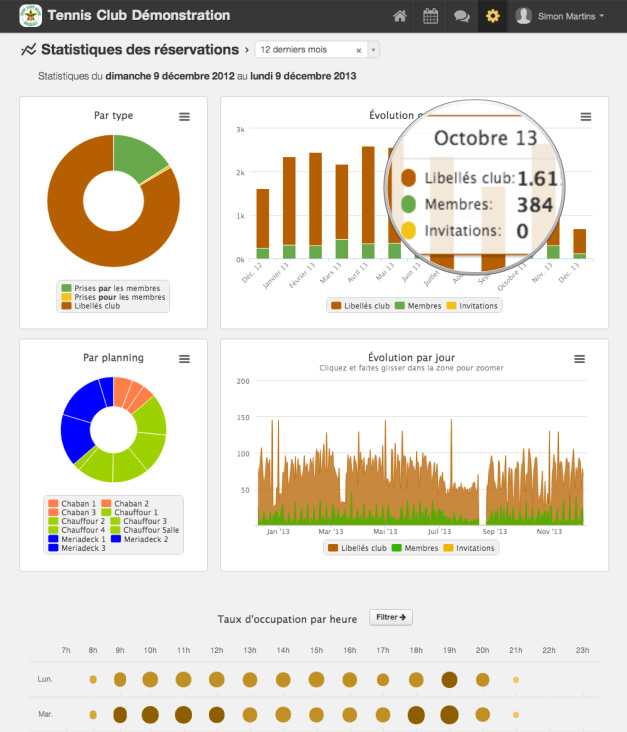
Reservation statistics
Use the drop-down menu at the top of the page to adjust the period. By default, the statistics of the last 12 months are displayed.
- By type (taken by/for members, club labels)
- By schedule
- Change by month and type (club labels, members, invitations)
- Evolution by day and by type
- Occupancy rate per hour and per day
- By day of week (Monday through Sunday)
- By hour of the day
- Graph of the use of predefined club labels
Here is a small overview...
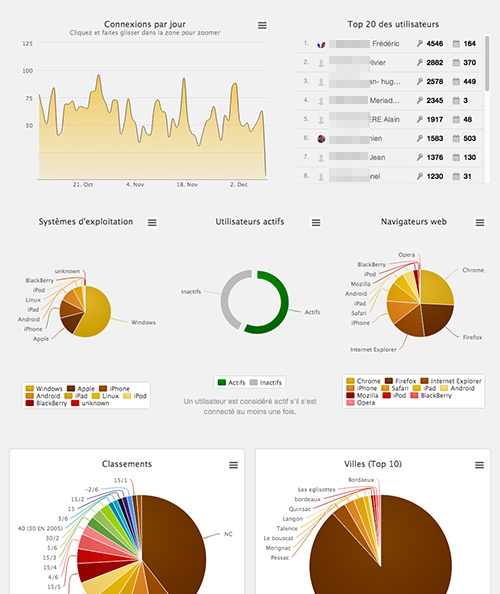
User statistics
These statistics are based on all the data of your club since its registration on YellowBall. You can't select a time period like on the reservation statistics.
- By gender(male/female)
- By profile & subscriptions
- Evolution by dayof connections (zoom possible)
- Top 20 users with display of the number of connections & reservations,
- Operating systems (windows, apple, iphone, ipad, etc...)
- Web browsers (internet explorer, chrome, firefox, ...)
- Active / inactive users
- Distribution of rankings
- Top 10 cities
- Age pyramid by gender
- Age distribution by category
Here is a small overview...
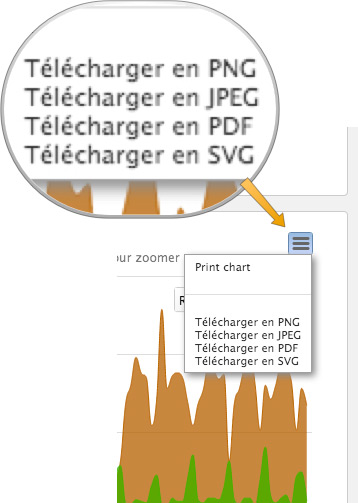
Export your charts
All the graphs can beprinted ordownloaded in several formats: PNG/JPEG image, PDF file, SVG (vector).
Click on the small icon (three lines) at the top right of each graph:
Click on the labels in the legend to hide some data and compare more finely: