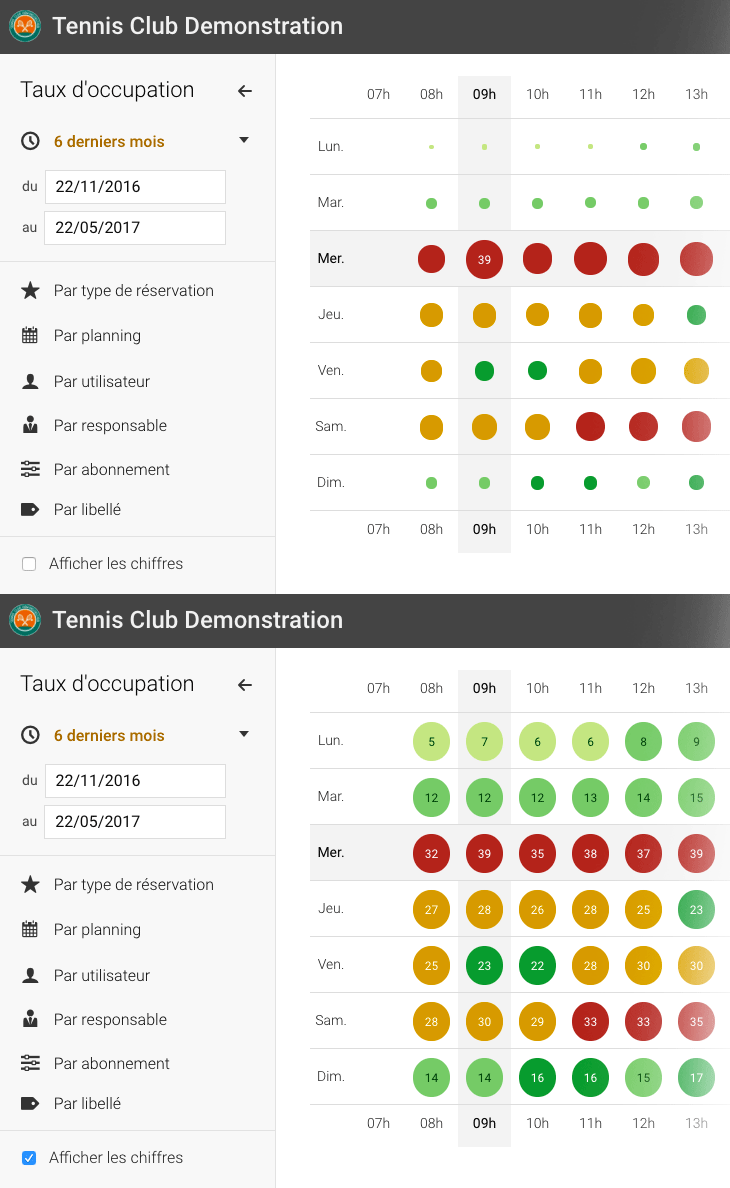
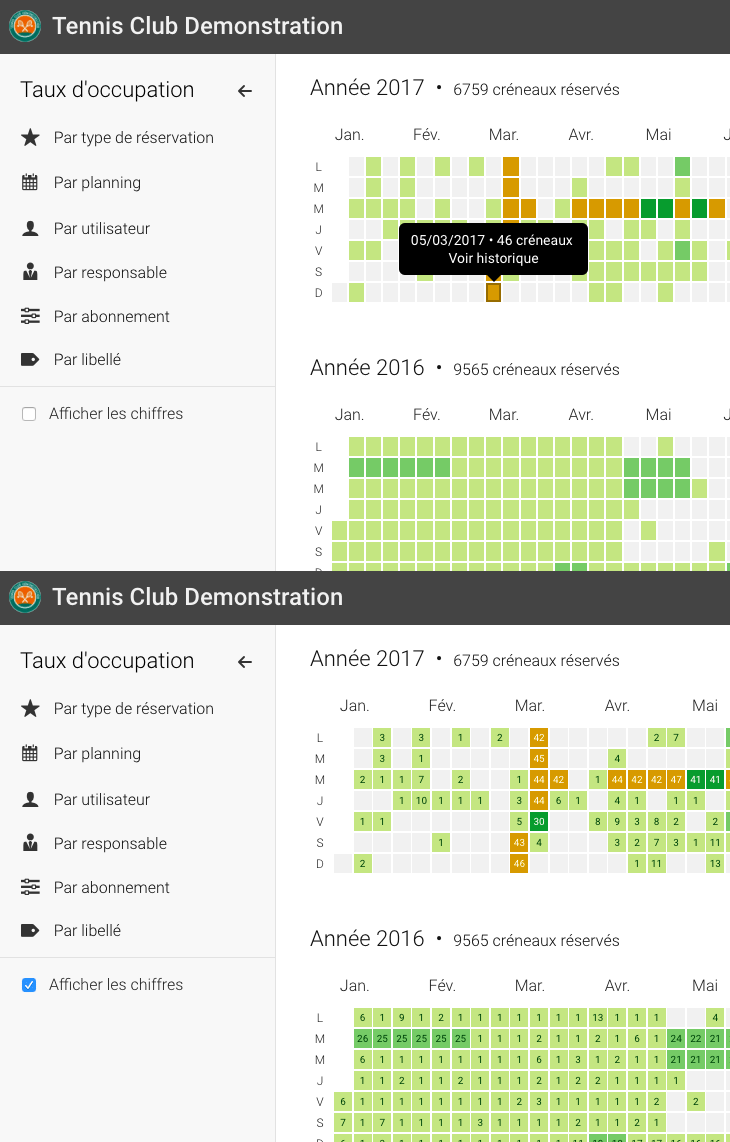
The modules allowing you to consult the most reserved slots have been updated to offer you a new and more colorful presentation.
The filters are now accessible from the left sidebar. This makes it easier for you to select a pre-defined period or choose custom dates. You can now easily select a pre-defined period or choose custom dates. You can also combine different filters to obtain precise statistics (by type of reservation, by schedule, by user, by subscription, by label...).
A new option "Show figures" also appears in the new sidebar to give you a global view and allow printing on screen or paper (see animations below).
Finally, you can now select several schedules with the "By schedule" filter, ideal for example to obtain statistics on outdoor courts only.


The BalleJaune team at your service!