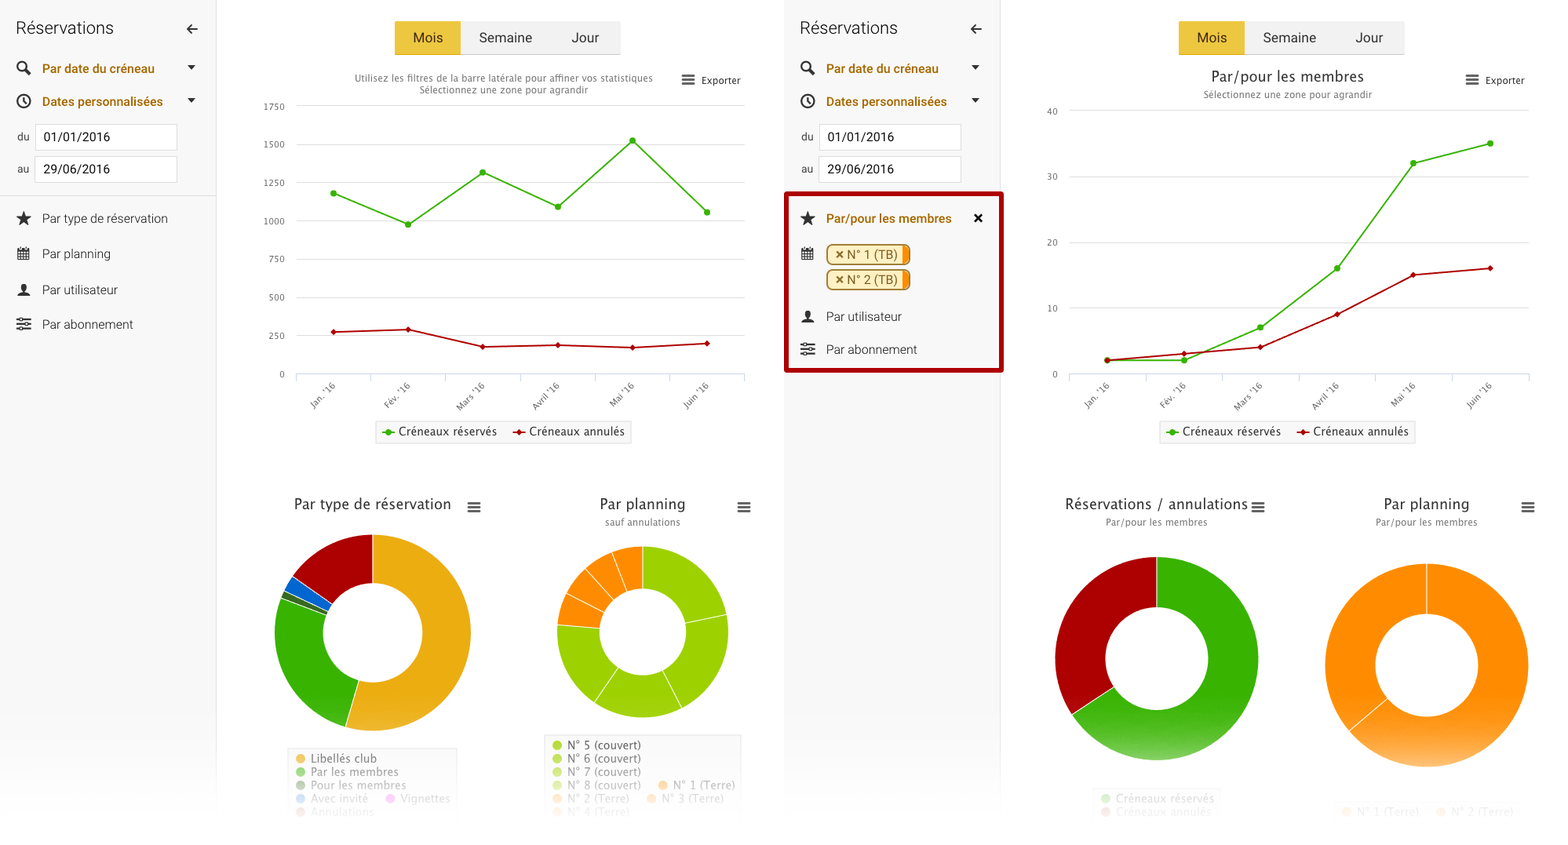
The "Reservation Statistics" module has been updated with the new "sidebar" interface. It is now easier to select a pre-defined or personalized period from date to date. Filters have also been integrated to allow you to fine-tune your statistics by reservation type, by schedule, by user or by subscription.
Go to BalleJaune in the menu Administration > Lists & statistics > Reservation statistics:

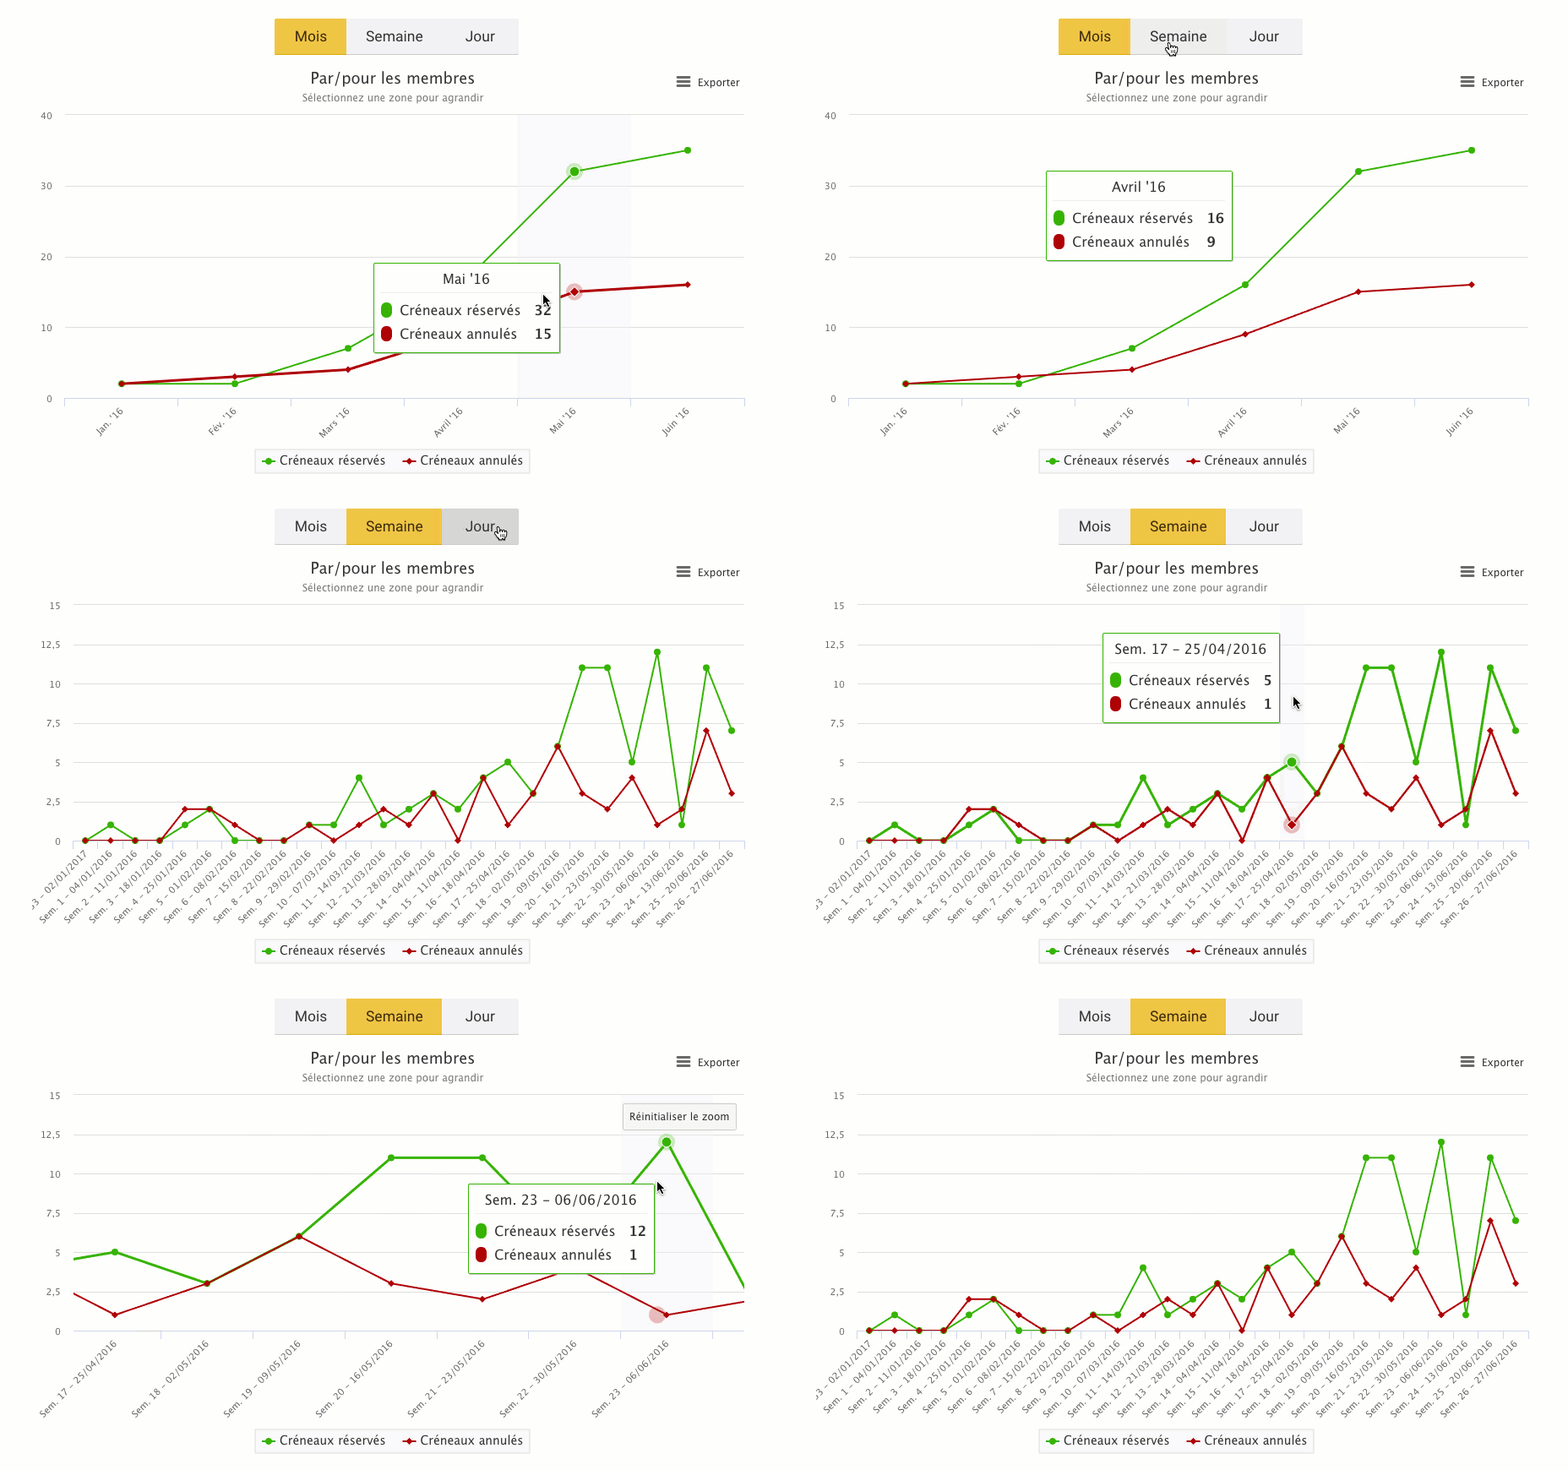
The reservation evolution graph has been simplified and it is now possible to zoom in the graph by selecting a zoom, ideal for the "per day" and "per week" views.

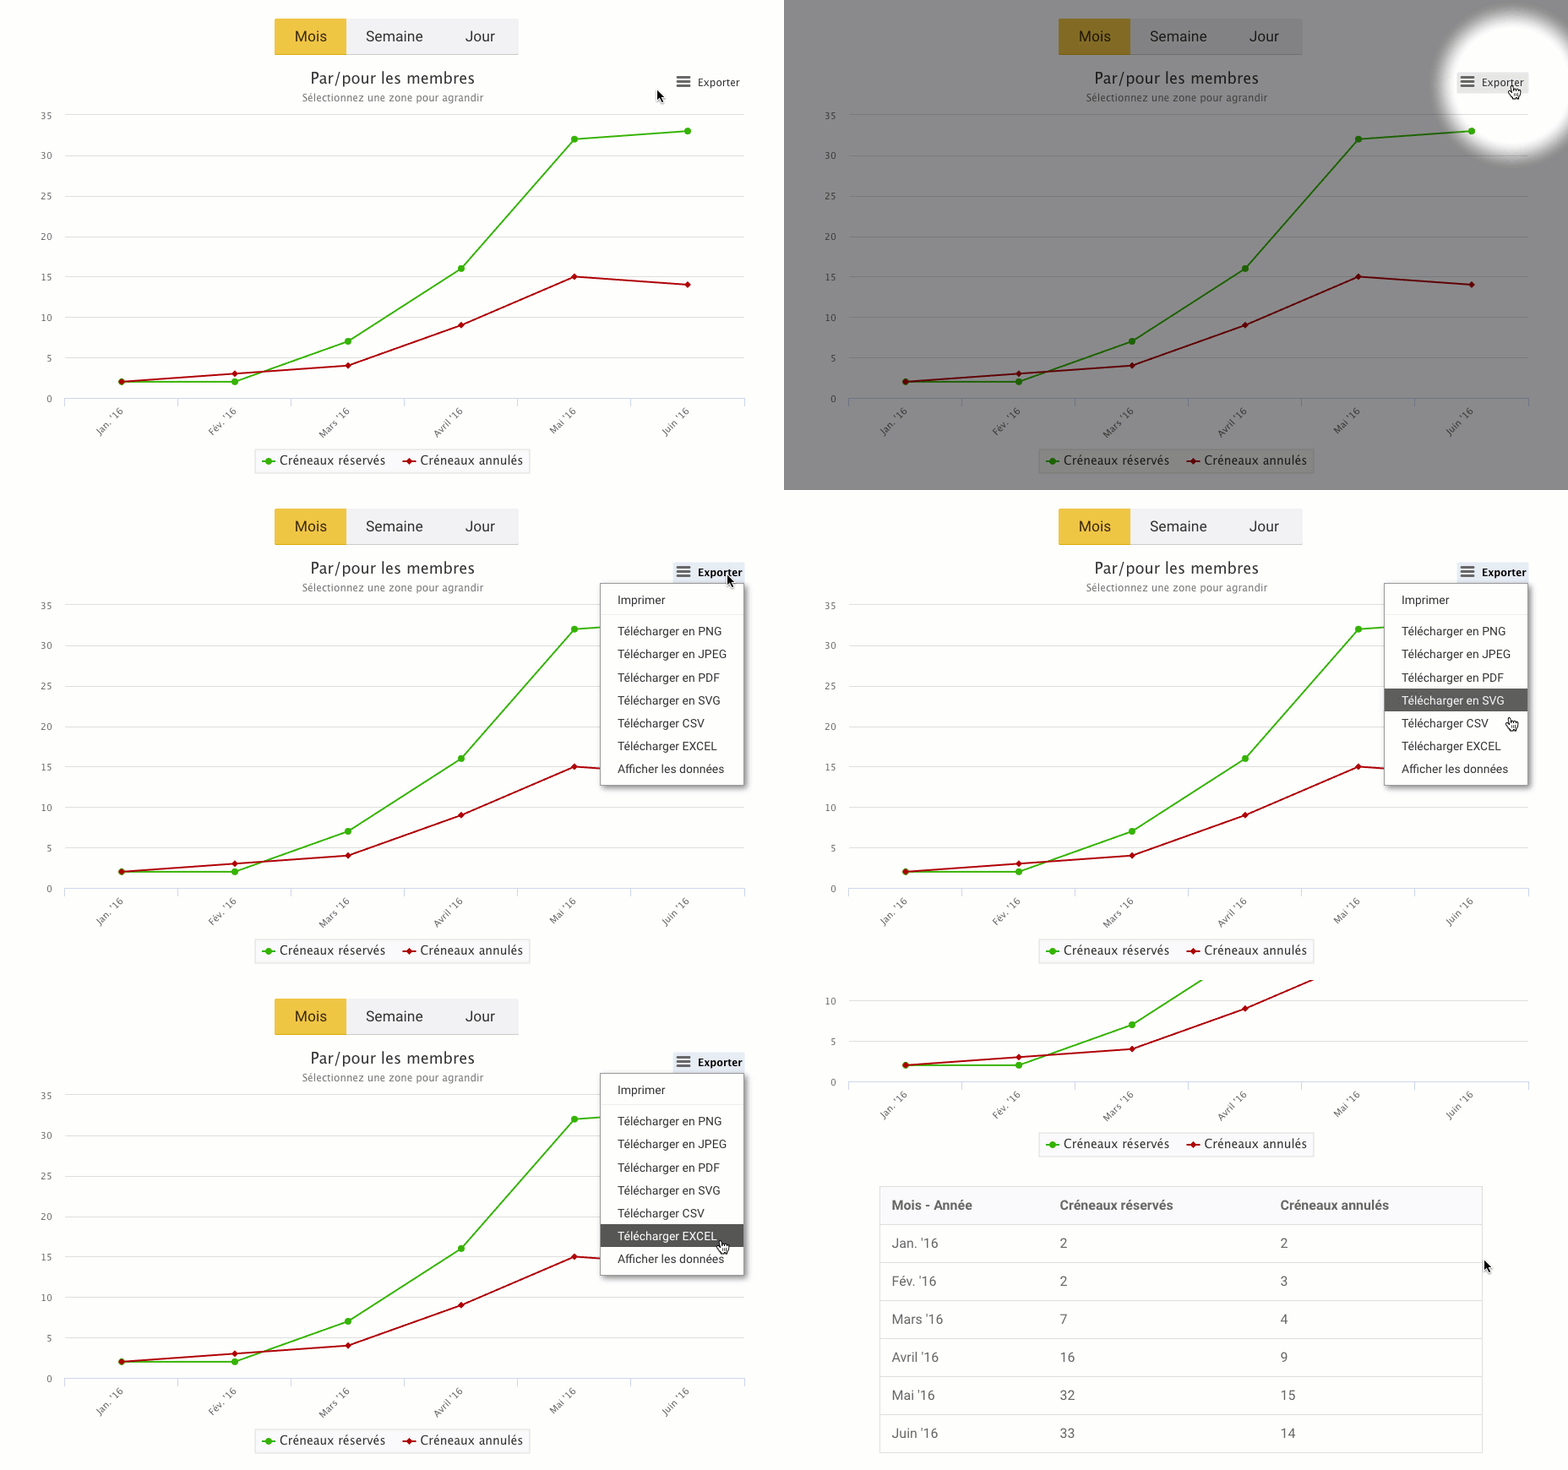
It was already possible to export the graphs as an image or PDF file, now you can view and export the raw graph data in Excel or CSV format!

The BalleJaune team is at your service!